
Project Description

01 Overview
Background

This is just one of my internship projects (for “University officials”) in the company, if you feel interested and want to take a look at my another project (for “Mentors” and “Mentees”), please check here.
The Challenge
For Personal
Running a startup, pivoting is a requirement. I worked closely with the CEO, developer and marketing colleagues. I participated from the very beginning of this project. As the only UX related people in the tech team, my tasks involve from market research, data management to front-end development.
For Company
Everything was starting from scratching. The company is kind of new, and there were only 5 people worked there during my internship period. Breaking through the time and budget limitations were our goal and mission.
02 From Start Up to Grow UP
Busy but happy
After the efforts, we finally launched our product, fulfilled our planned goals and made profits too.
Let’s see the final impacts first.
Product Side
Success Rate
Company & Client side
The Process
How to get there?

Image: the working process
03 Digging into the project
Explore, Research, Design, Implementation
It was a very interesting process to get to know our company’s culture and success metrics. We all know, mentorship is the relationship between a pupil and a professional in which the mentee gains knowledge, while the mentor gains the opportunity to pay it forward and give back some of his/her knowledge to someone who will appreciate it.
Why is it important?
Mentorship is vitally important to the development of college students because it provides them with a basis for building a realistic expectation for their professional careers. Mentorship is definitely important for students since students can improve their career confidence after working with a mentor. Mentorship is also important to mentors because it provides them with an opportunity to teach, detail their experiences, and talk about themselves.

Image: Mentor Attachment

Image: Student Engagement
The more time I spend on the project, the more I enjoy what I do. I really like the idea that helping more and more students like me to build confidence on their future career paths. And I deeply believe our product should have a satisfactory result on the market, especially when I got the data from our research:

Image: our product decisions
Why we made the product decisions?
Video: online resources
After finishing the online resource, we found it was not enough; and we should keep going to develop more features. Based on the feedback, we find new challenges:

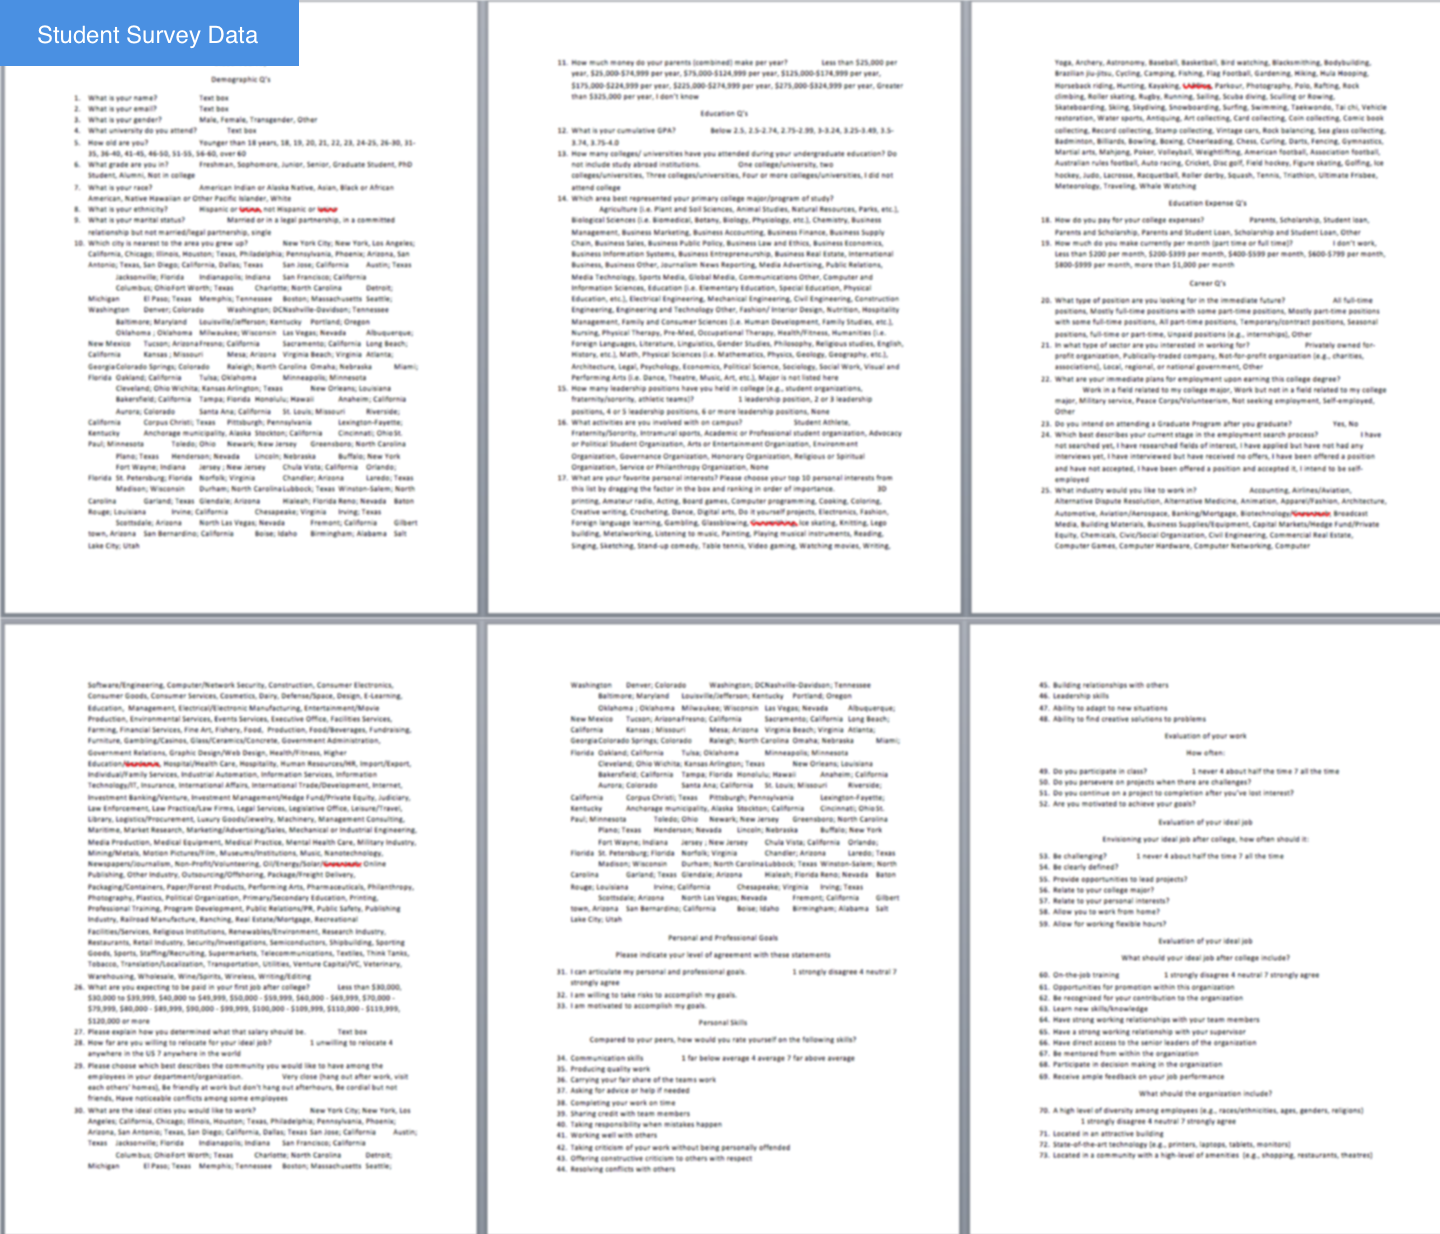
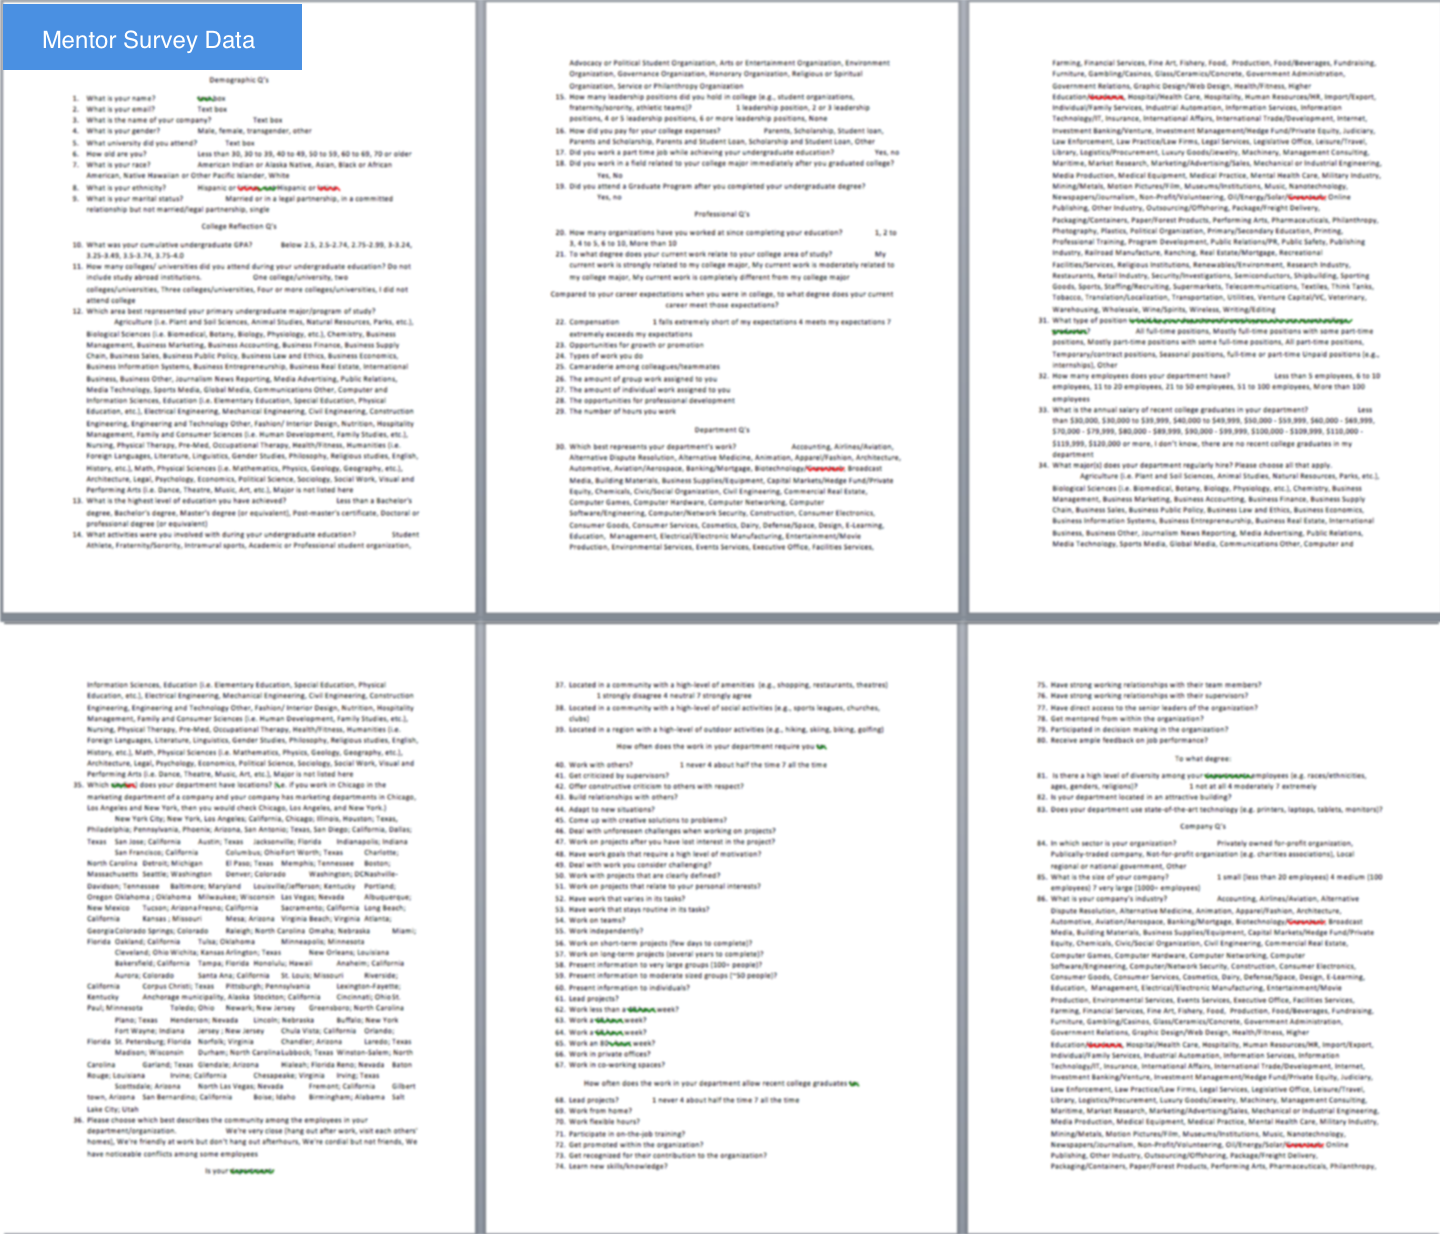
After building the online resources, the low conversion rate was the biggest challenge that the company was facing at that time. The online resource would be the most effective way for potential clients to get know about our company. We did many surveys to collect fresh data once a month and showed the most impressive data analysis result through the videos on our online resources. However, the click rate of the video did not look good. It’s a new era, data is speaking everything. If we do not provide sufficient results of the analysis for clients, they would not be convinced by us or invest money to our project. Plus, we have already put many efforts on the data analysis, therefore, there should be a place for us to show our process.
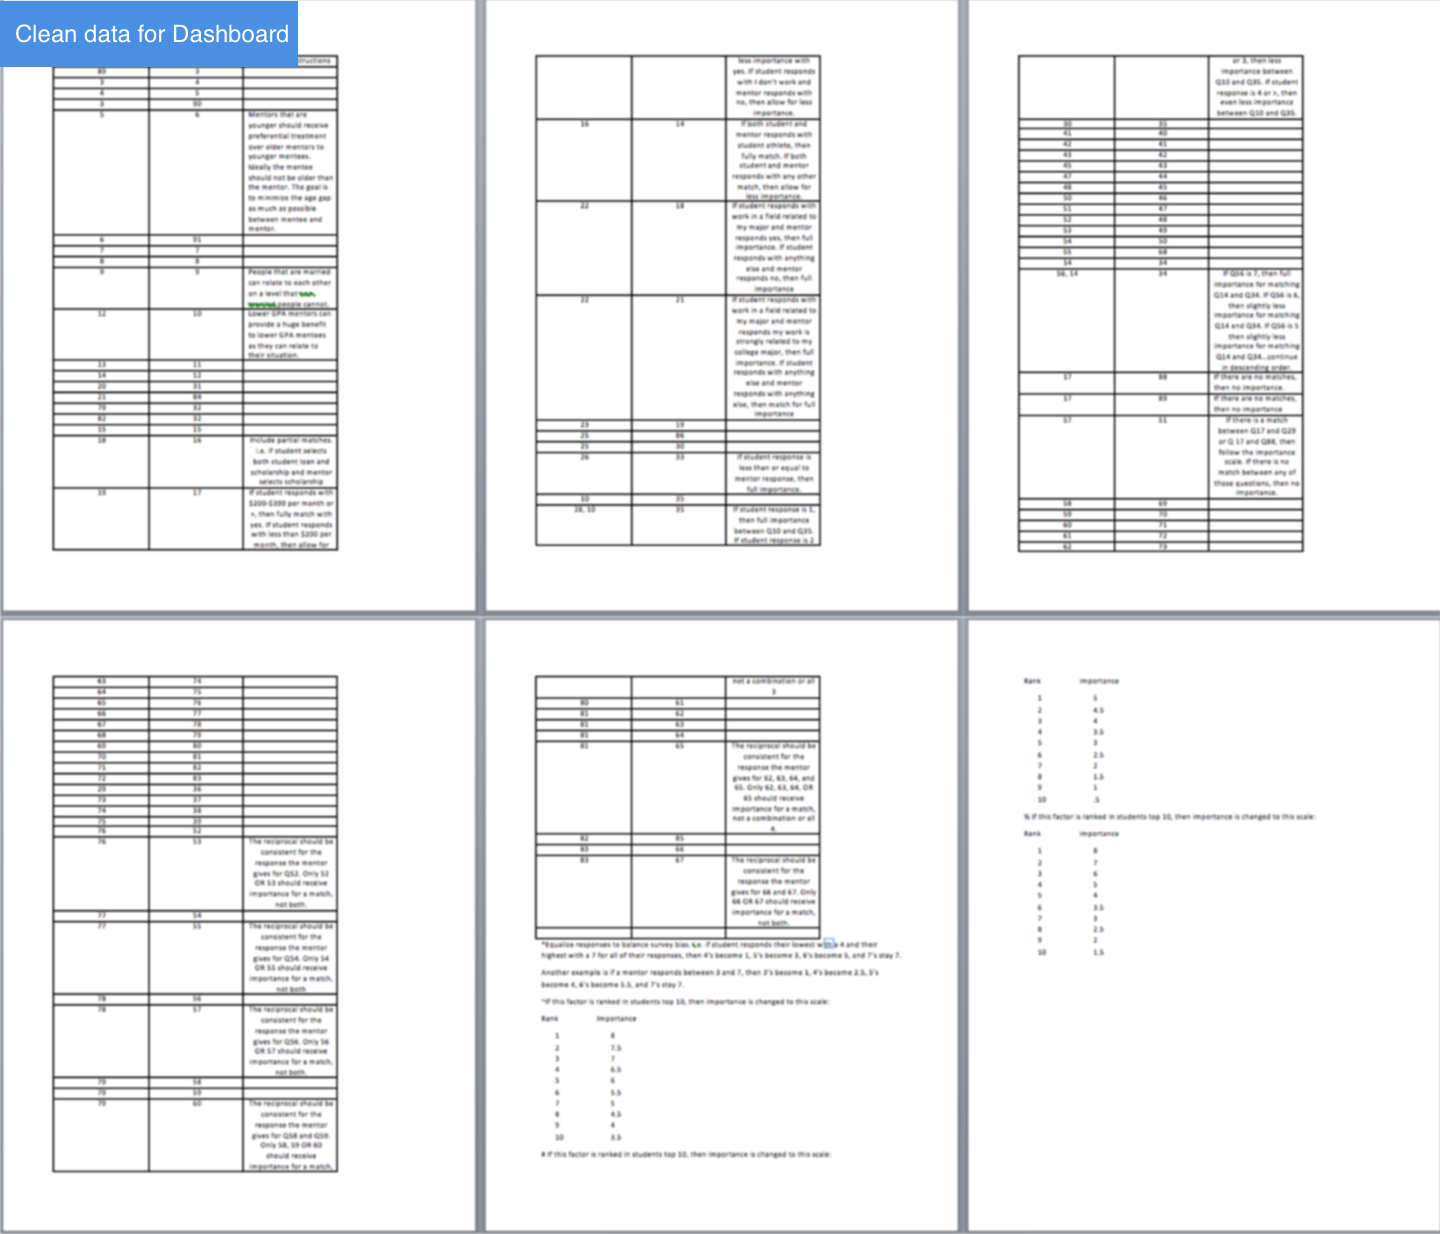
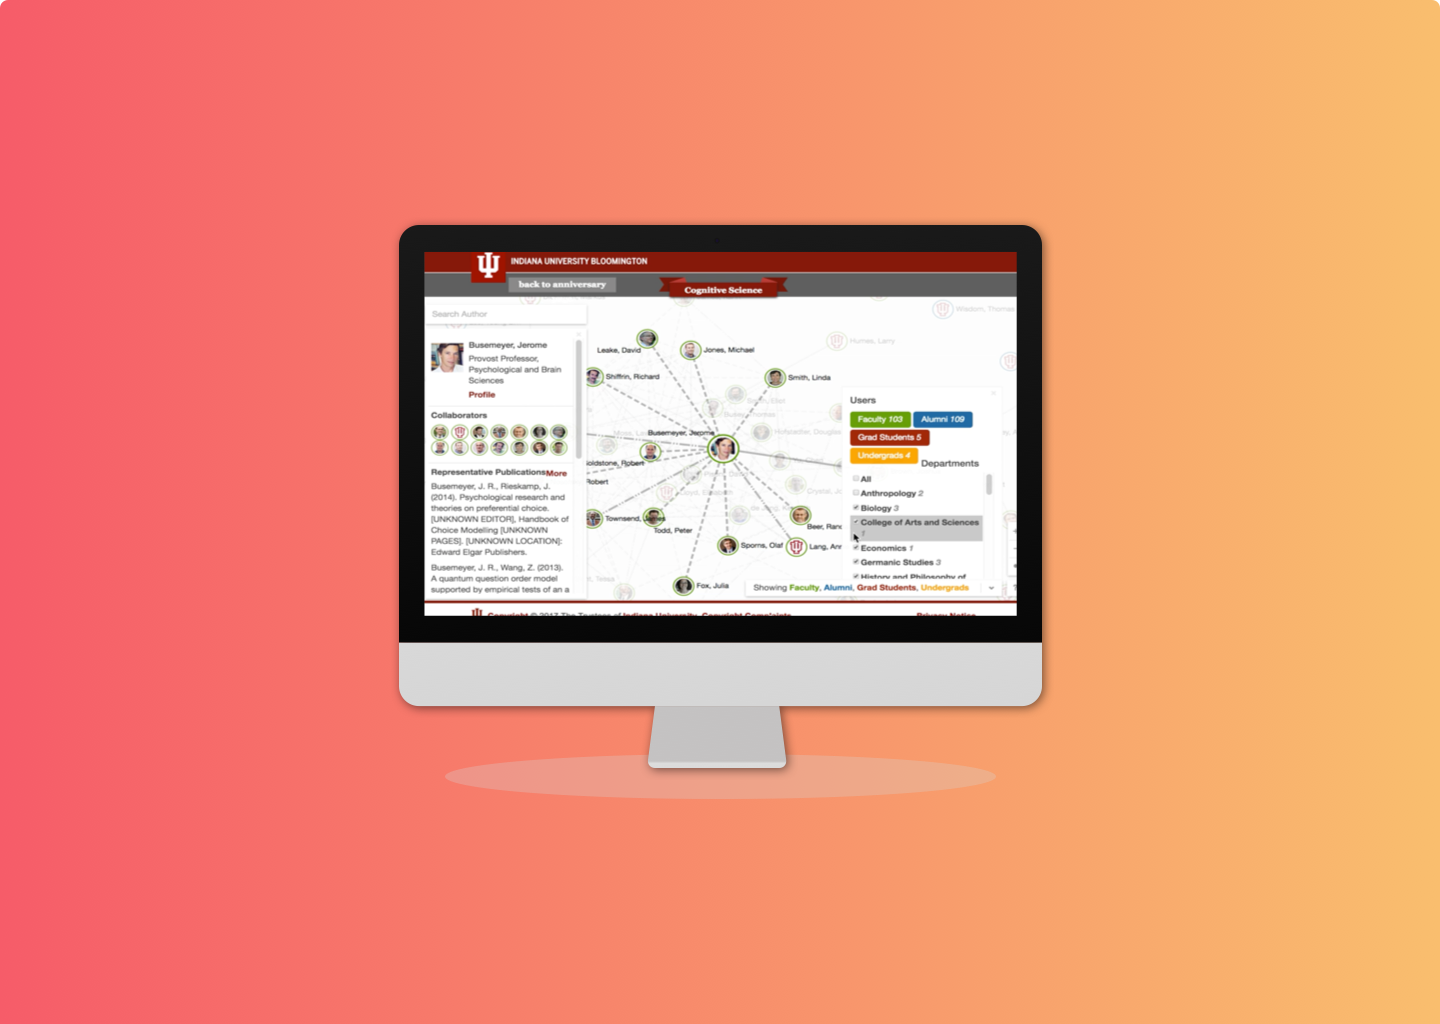
After then, our solution came out: a dashboard. Yes, a dashboard that can allow our clients, university officials, to see the success of their mentorship efforts overtime by the latest data.
A quick glance at the details
The Sitemap

At the beginning of our development process, we pointed that the register & login system and dashboard were the most difficult parts for us. In the future, we also planned to add “Search” system on our webpage.
We tried a lot of ways to build and test our login and dashboard systems, luckily we made it!
User Journey Map & Wireframe

UI Highlights

The Development
The general layout of my previous work is shown on the website. I am also working to improve the functionality of the website as well as the dashboard content.
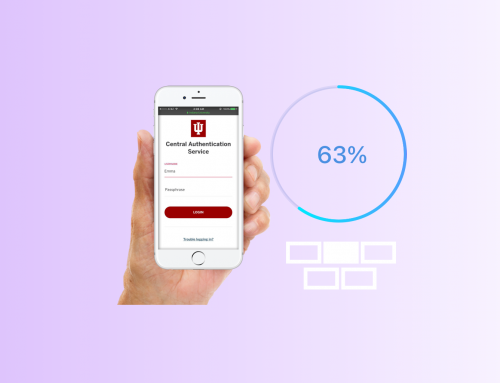
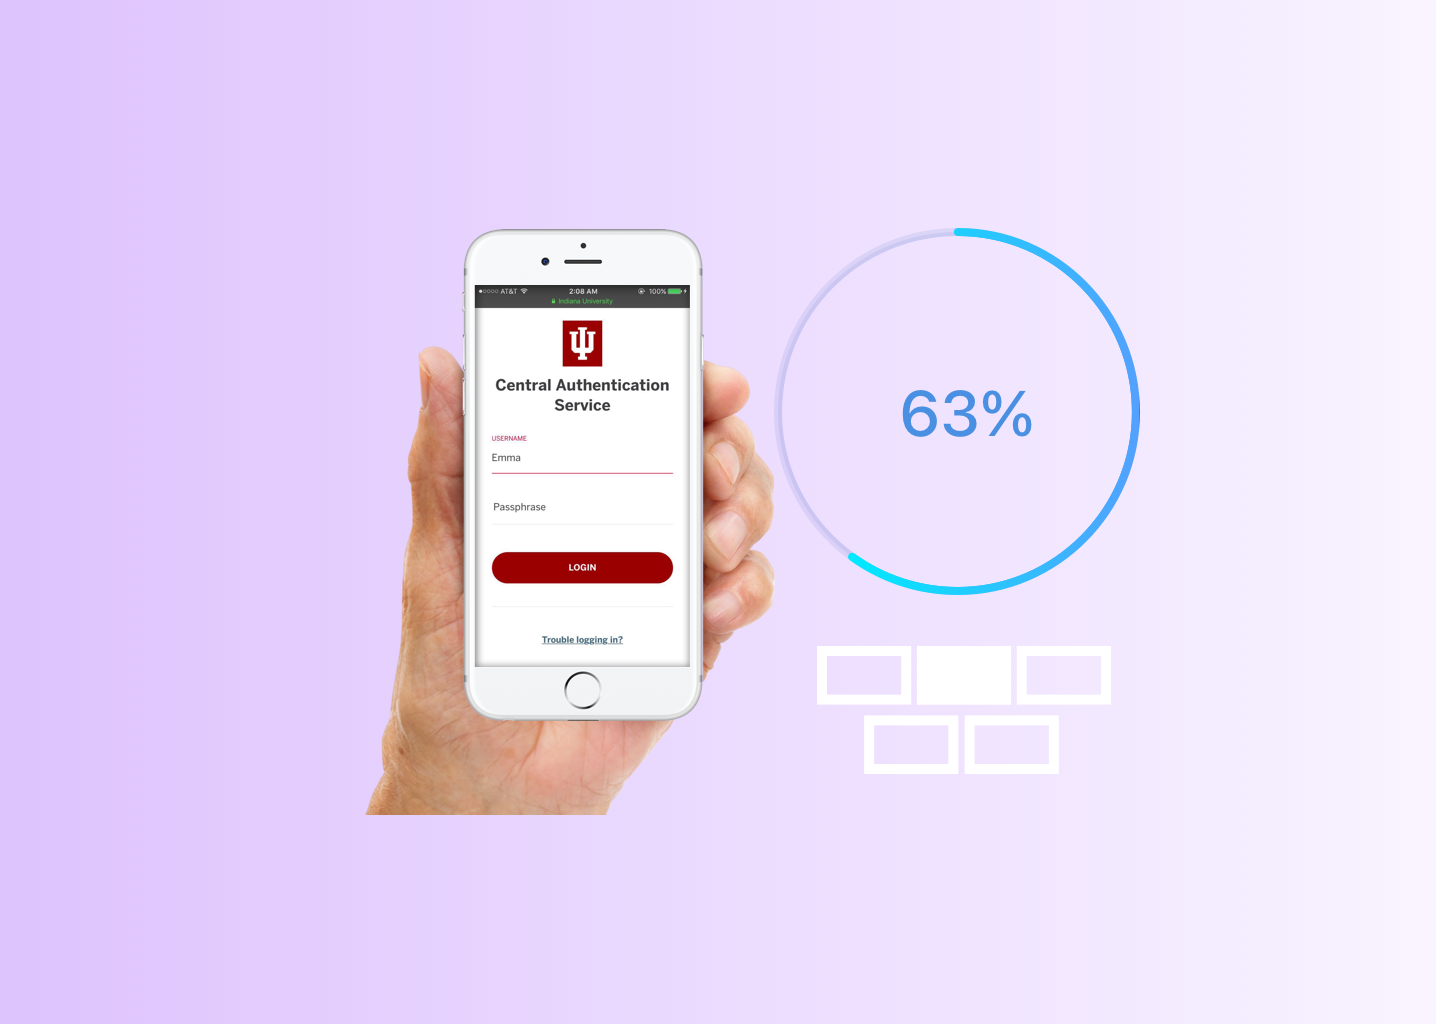
Login System
I developed a login and register function recently to make sure university officials will have access to a personalized dashboard by unique usernames. On the dashboard, they will have access to sorted data based on university location, department, as well as the organization.

Functionality
- Successfully login
- Incorrect password/username
- Maximum times of login restriction
- Password reset
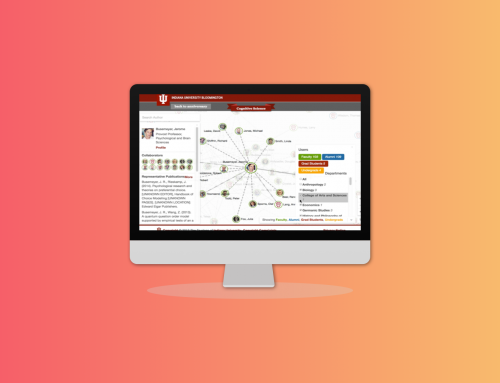
Dashboard
The purpose of the dashboard is to allow the University officials to see how successful the mentor-mentee engagement program is.
There is a great amount of information and data about mentor and mentee engagement process available on the dashboard. The stats include prospective job matching, student outlook, immediate feedback from students’ and mentors’ experience and so on.

I was helping to do the market user research and was working on designing and implementing the information architecture and UI of the dashboard, as well as the data visualization of the data results. I also worked on MySQL database to figure out a solution that can make the data visualization graphs to automatically refresh along with the database updating.
Attractive Features
- Personal dashboard along with unique account name
- Work in conjunction with data retrieved from SQL database
- Updated real data based on research
Design Madness:

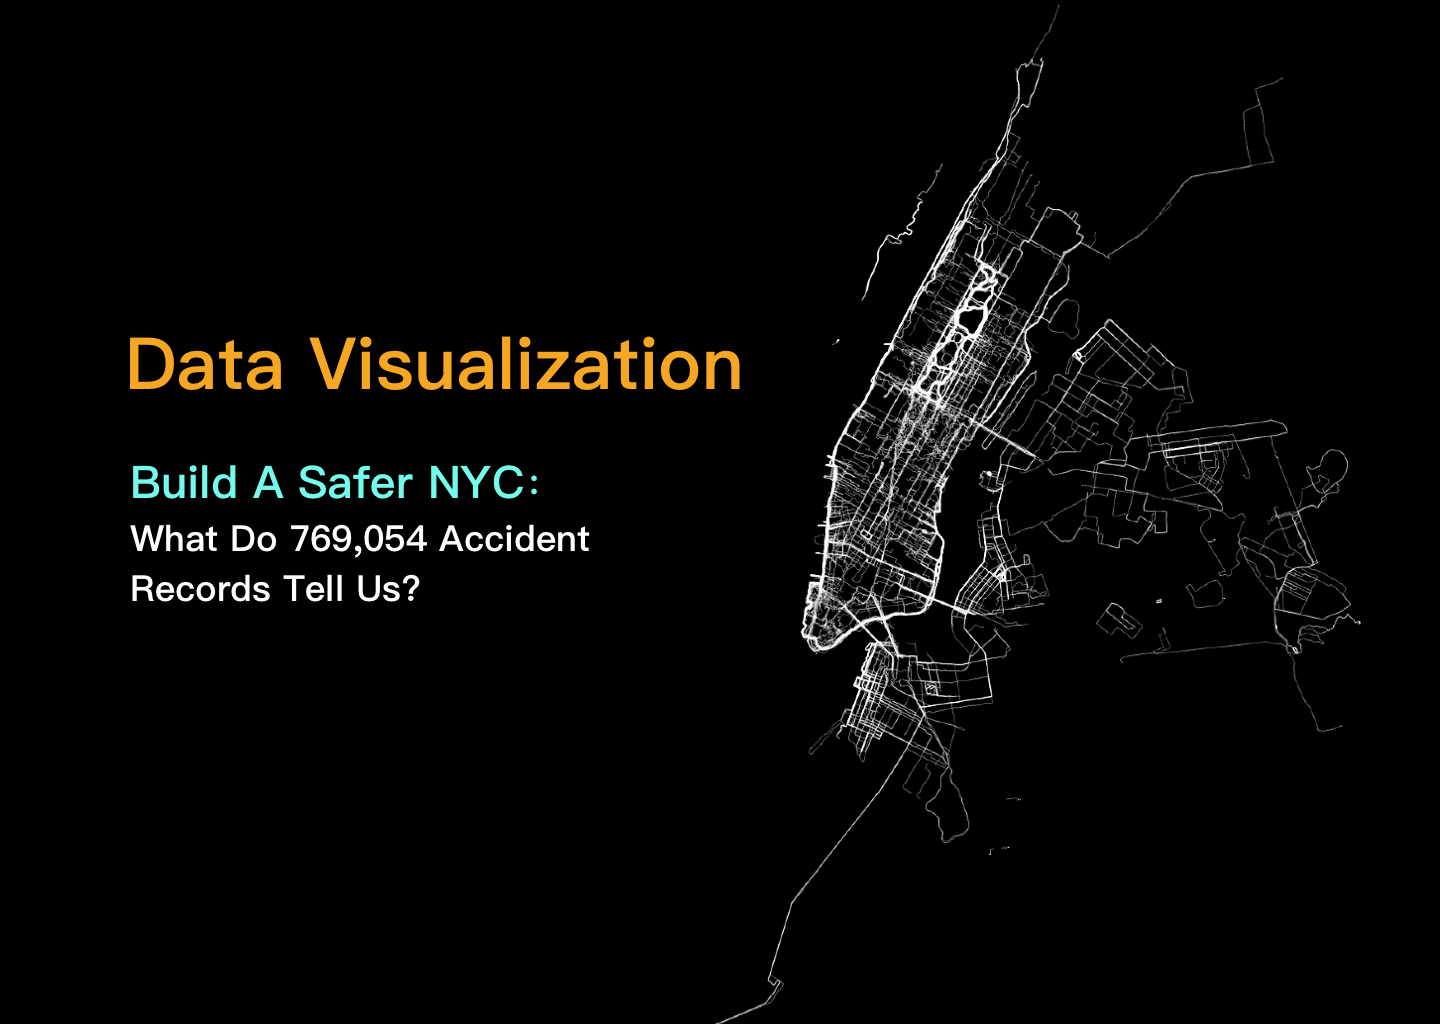
The data analysis
Due to the NDA, I made them mosaics.
The coding:
Everything was starting from scratching. I once even tried to code the login system, although finally, I found a better way.
Check them out for fun! I know they are ugly, that’s why I gave up them and tried other ways at the end.

Technology: HTML5, CSS3, JavaScript, Google Charts, and Bootstrap.
04 Feedback
What do they think
Clients love our ideas

The CEO feels great about our product

I’m feeling super confident to show our first client this new dashboard! We have real data!
Meet my excellent team

Mine areas of focus:
- Marketing research
- Design and implementation of the user experience platform for company
- Data collection and management
- Content Strategy
- User account management
- Design and implementation of the login and redirection functions
- Dashboard measurement
- Design and implementation of a dashboard to work in conjunction with the data retrieved from SQL database
- Usability Testing
- The Launch
05 Reflection
What I have learned
I cannot show the process details due to the NDA, but I can tell you what I learned.
Stay Hungry:
Design is more than a beautiful interface. You should learn from users and care about the product. Think about the big picture first, learn from users then define the product from both clients’ and company’s sides. Stay hungry to learn new skills and always try to help co-workers beyond finishing your own work.
Communication Matters:
As a leader in our small design team, I need to ensure that everybody was aware of what needed to be done and was on the same page. Breaking down the long-distance plan into small pieces is especially important; scheduling weekly goals to accomplish can make things easier.
Detail Madness:
This is no longer a school project. Launching something for real requires absolute attention to details. Never forget to do either the database testing or usability testing before showing the product to your clients. There is no perfect design, we can always improve it.
What the CEO says about me:

Future Work and suggestions for Ambition In Motion Company online product:
1. Search engine optimization (SEO) Analysis. ( Could use google analytics)
2. Search function.
www.mentorresource.com/ shows how the work goes until now. Check by clicking here.